IBM BLUEMIX: CHECKING THE ULTRAVIOLET INDEX WITH RASPBERRY PI / SENSE HAT CONNECTED TO IBM WEATHER COMPANY DATA
- Layout for this exercise:
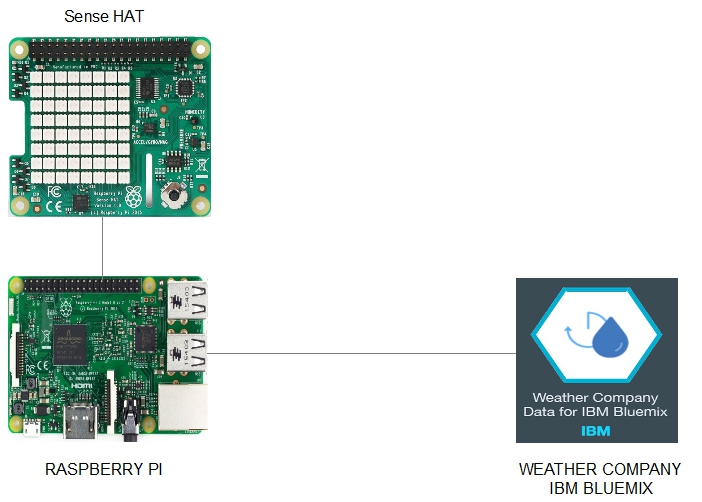
1 - Creating an instance of Weather Company Data IBM services
- The goal of this exercise is to build an Ultraviolet (UV) rays indicator using a Raspberry Pi device with Sense Hat and NODE-Red accessing the Weather Company Data IBM Bluemix.
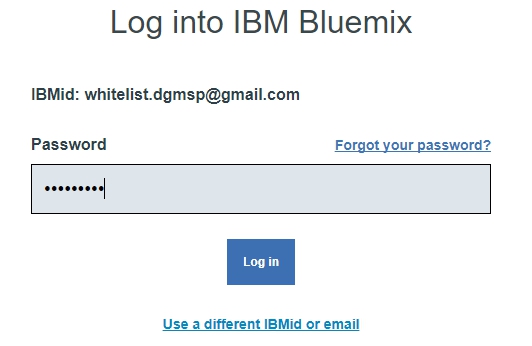
- Signing into an IBM Bluemix account:
- Going to Catalog and searching for "Weather" the result is Weather Company Data:
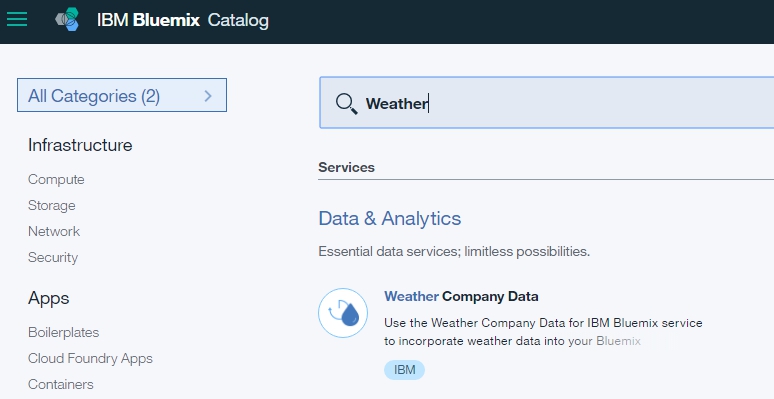
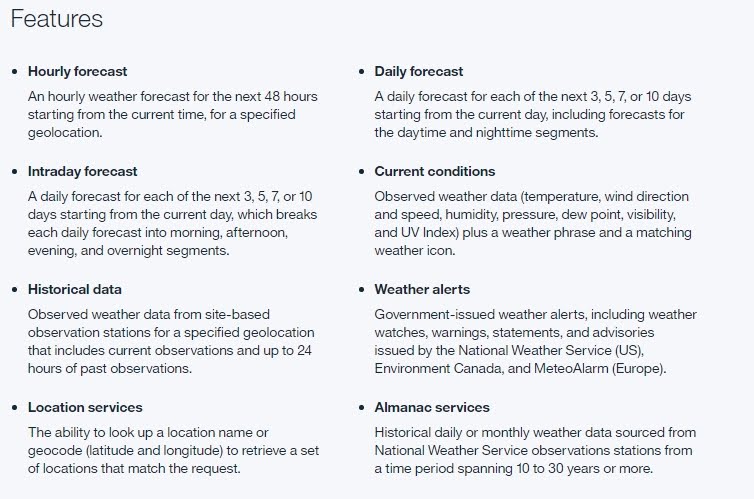
- Weather Company Data is a service that allows the integration with IBM Bluemix:
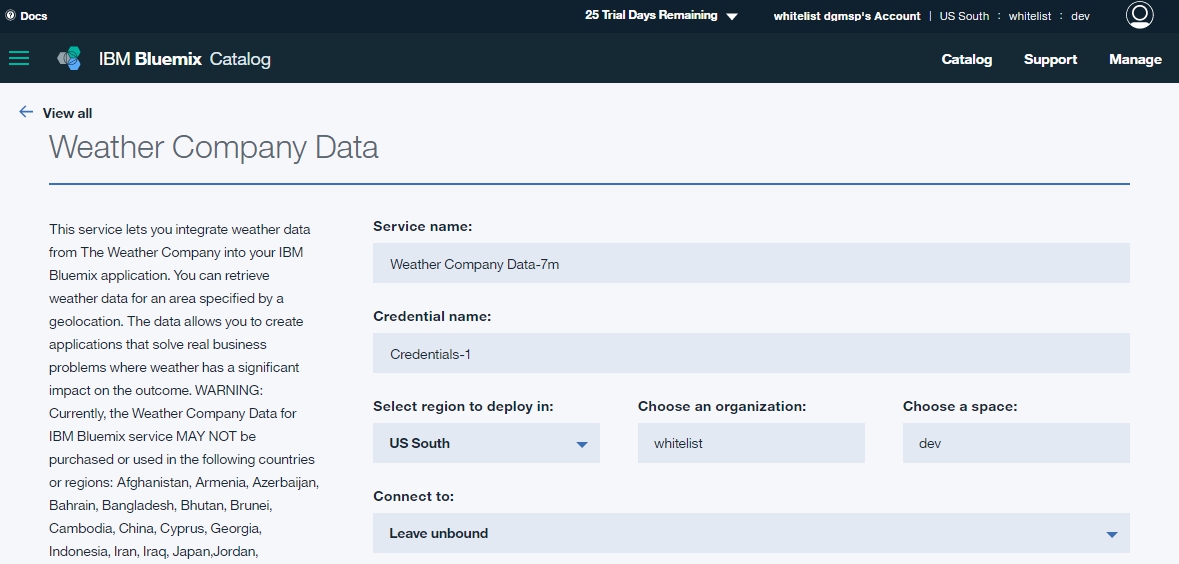
- This service has a great range of features related with weather forecast, for instance Current Conditions provides data about UV Index:
- Clicking Create:

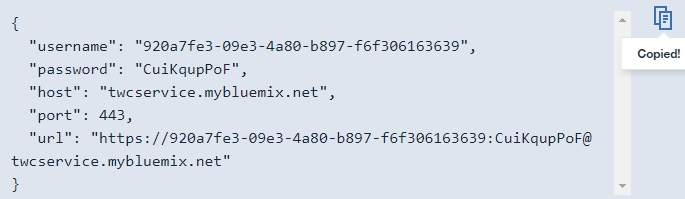
- Some Service credentials are generated that must be written down for later usage:
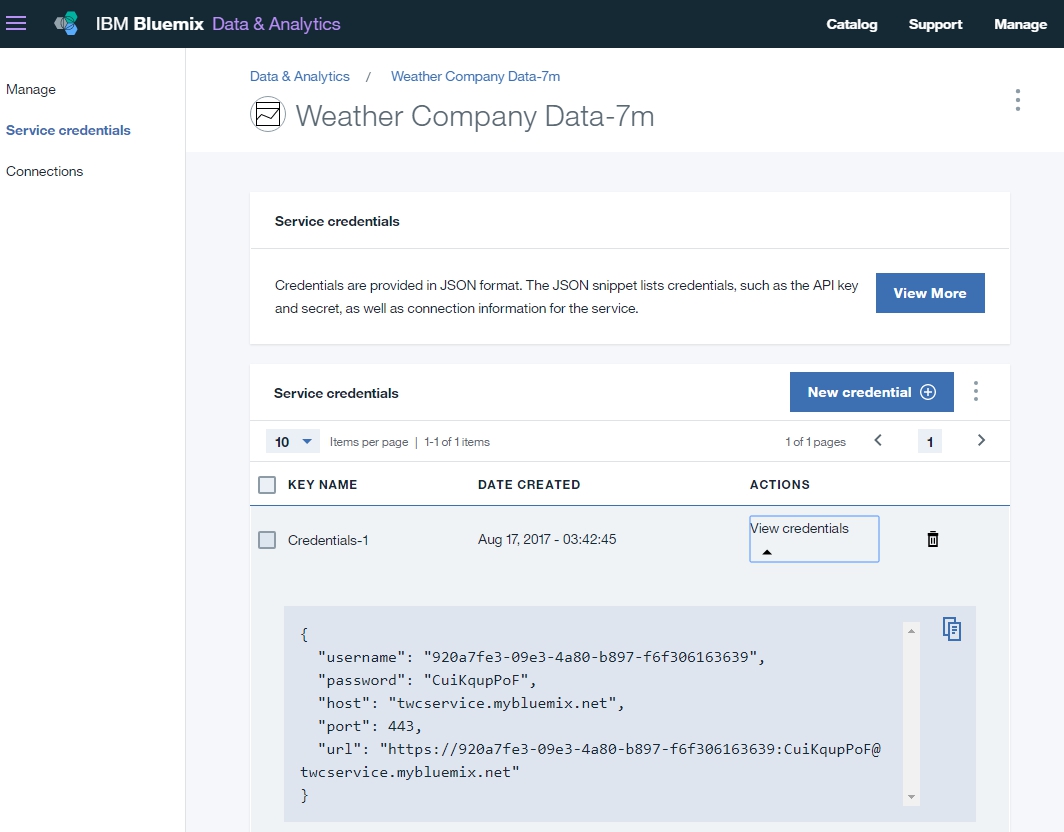
- Copying to the Clipboard the Service Credentials:
2 - Creating a NODE-Red flow
- Installing additional NODE-Red nodes necessary for accessing IBM Weather Company Data for Bluemix:

- Starting NODE-Red:

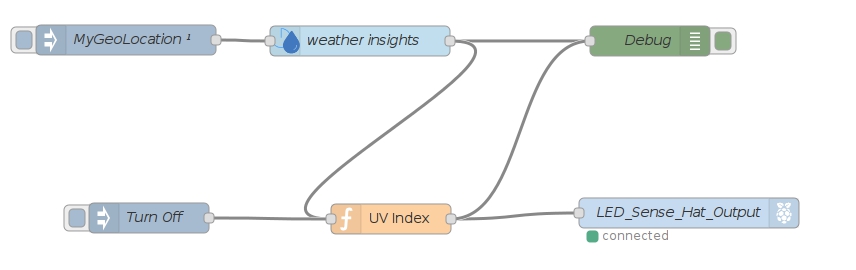
- Now, a NODE-Red flow must be created composed of 6 nodes:
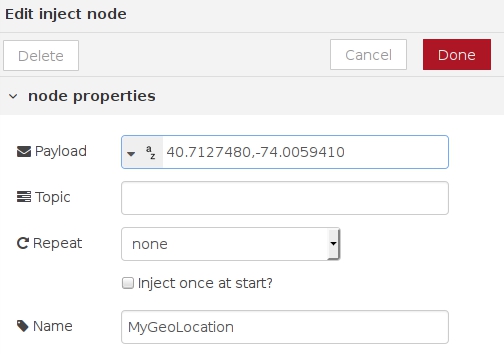
1) Inject

- The payload of the inject node is the geo position (latitude and longitude) of the location of New York City:
http://mygeoposition.com/
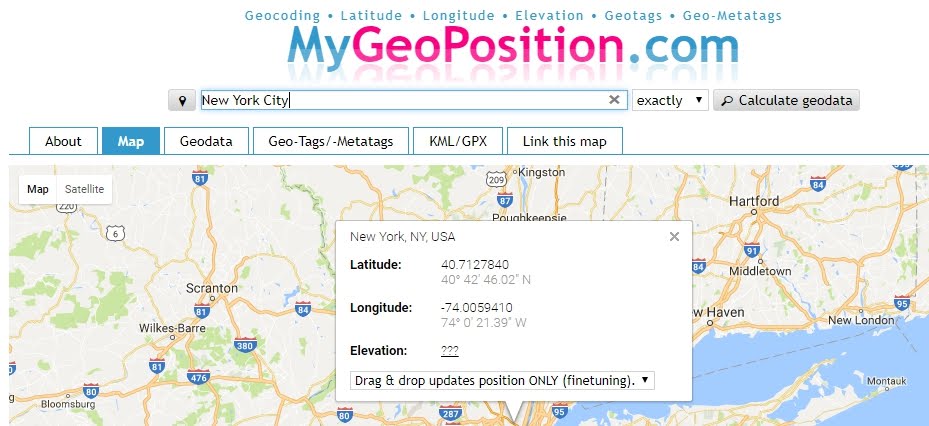

- Entering as payload the Latitude and Longitude of NYC:
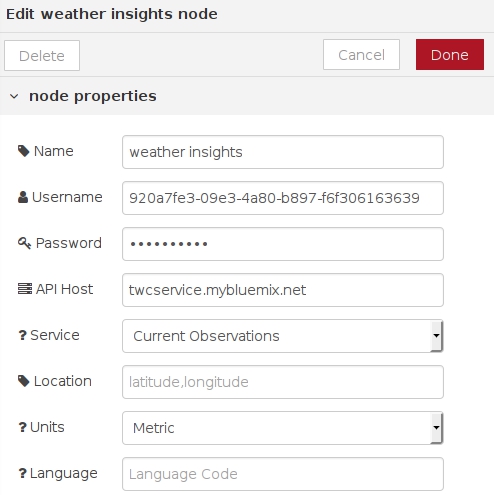
2) Weather Insights

- Entering Username and Password obtained at point 1 (Service credentials) and Current Observations as a Service:
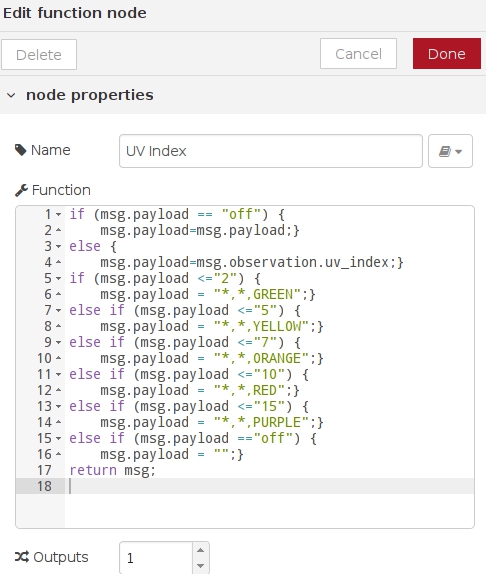
3) Function

- The function node uses JavaScript code to process the payload coming from the previous node weather insights.
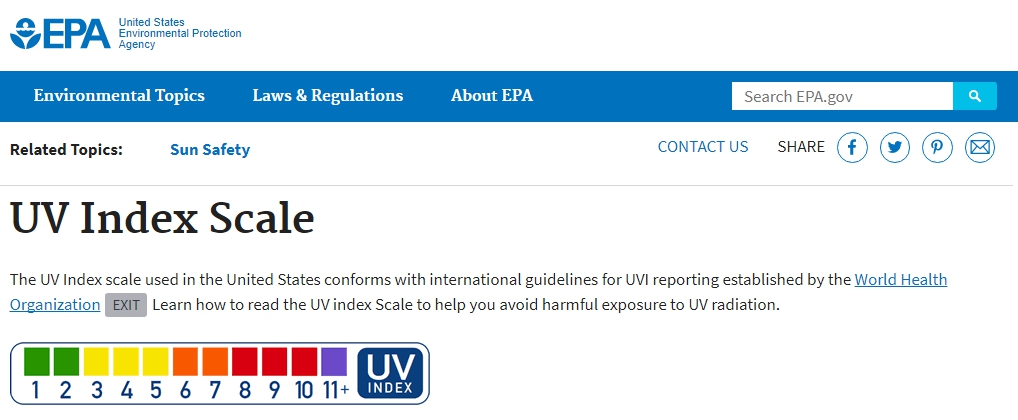
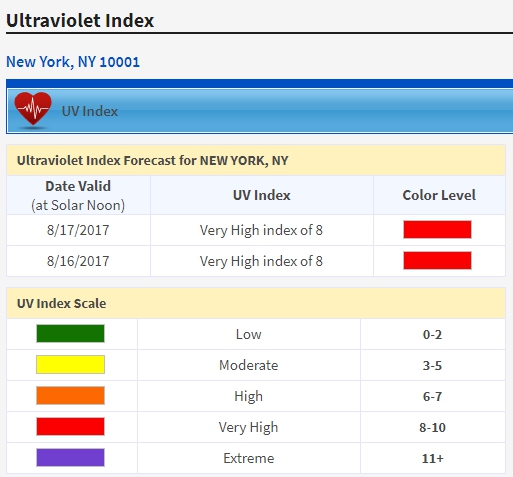
- Editing the node, the conditional statements (if ... else) are based on the Colour Index Scale provided by the United States Environmental Protection Agency.
- Also, when an "off" payload is injected the Sense Hat LED is turned off (we''ll see in next nodes):
https://www.epa.gov/sunsafety/uv-index-scale-1
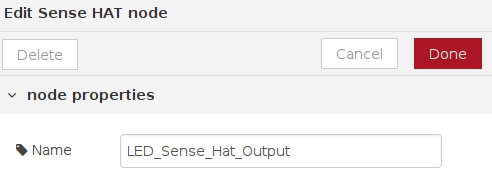
4) Sense Hat

- This node corresponds to the Sense Hat module, and no special configuration is needed aside from giving a name (LED, because its color varies according to the UV Index):
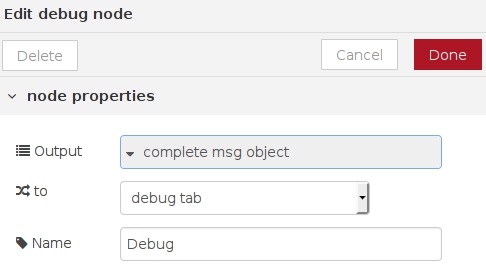
5) Debug
- The Debug module displays the output obtained from the function and the weather insights nodes:

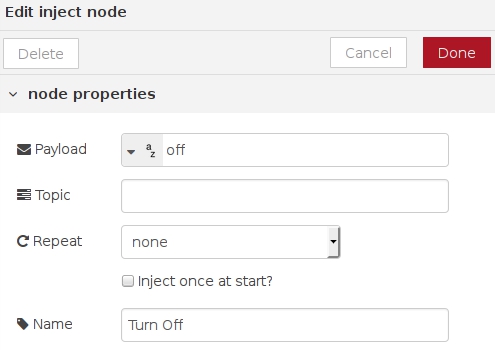
6) Inject
- The last node injects the string "off" to turn off the Sense Hat LED node:

3 - Testing the system
- Deploying the flow:


- Starting the MyGeoLocation node:


- The flow starts working:
- The LED turns on RED because at the time of the test the UV Index at New York City is closed to 8:

- The Debug tab displays the RED value and the associated New York City's geolocation:

- To check that the test is correct let's consult another UV Index source for New York City:
http://legacy.weather.weatherbug.com

- Finally the node can be turn off:


