AdSense

Sunday, August 20, 2017

IBM Bluemix: checking the UltraViolet Index with Raspberry Pi / Sense Hat connected to IBM Weather Company Data


IBM BLUEMIX: CHECKING THE ULTRAVIOLET INDEX WITH RASPBERRY PI / SENSE HAT CONNECTED TO IBM WEATHER COMPANY DATA

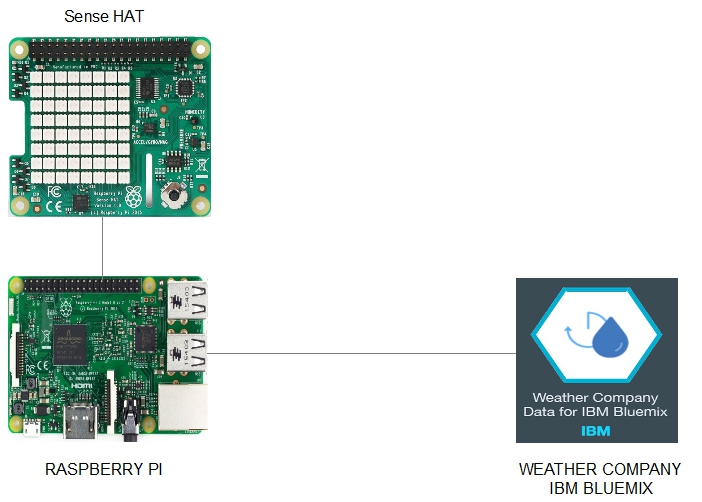
- Layout for this exercise:


1 - Creating an instance of Weather Company Data IBM services

- The goal of this exercise is to build an Ultraviolet (UV) rays indicator using a Raspberry Pi device with Sense Hat and NODE-Red accessing the Weather Company Data IBM Bluemix.

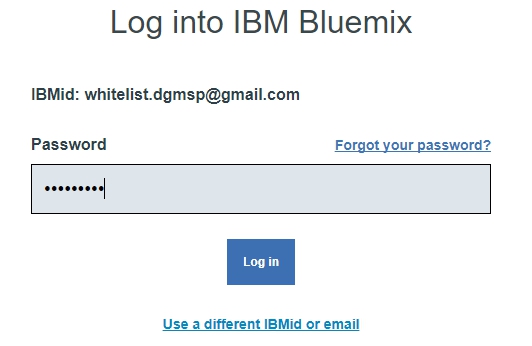
- Signing into an IBM Bluemix account:


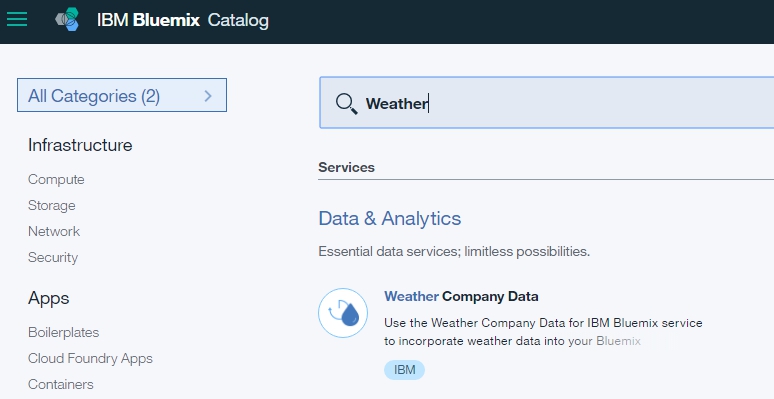
- Going to Catalog and searching for "Weather" the result is Weather Company Data:


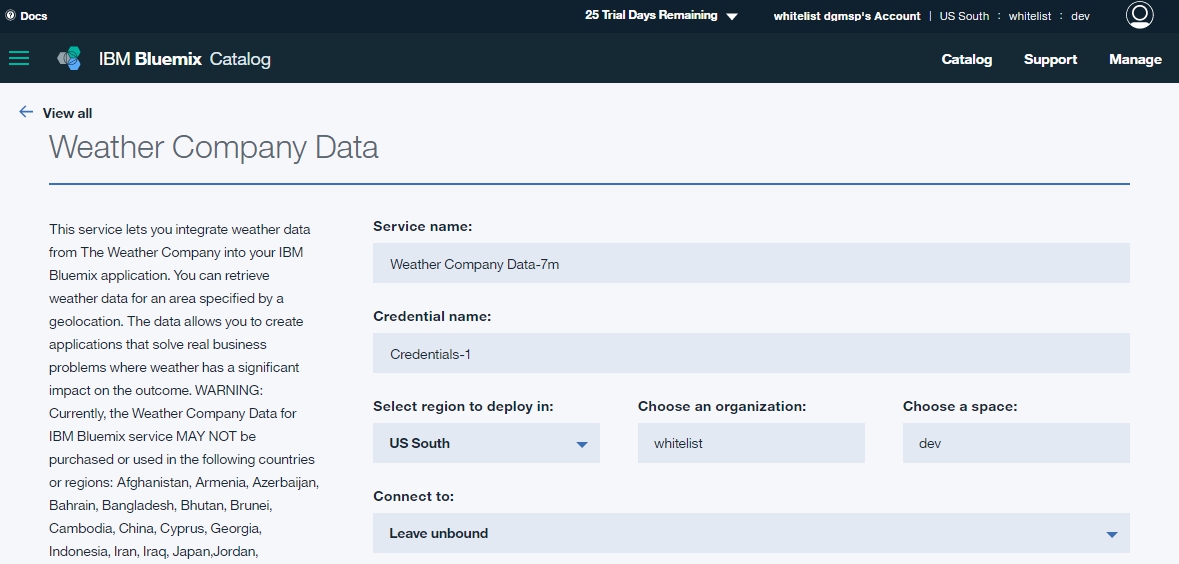
- Weather Company Data is a service that allows the integration with IBM Bluemix:


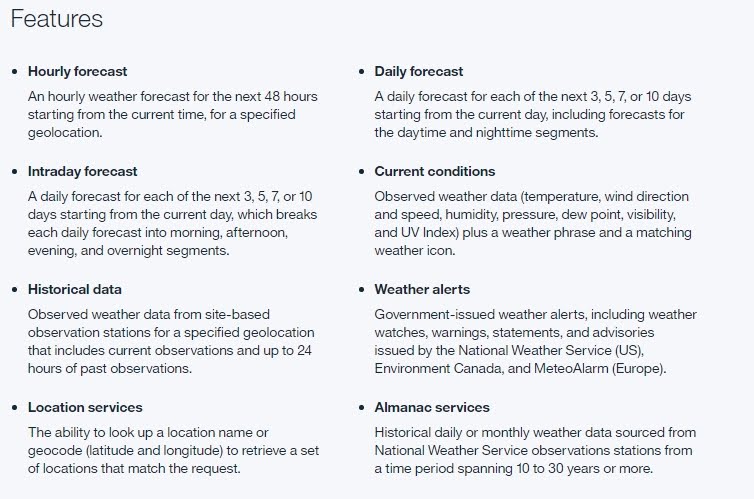
- This service has a great range of features related with weather forecast, for instance Current Conditions provides data about UV Index:


- Clicking Create:


- Some Service credentials are generated that must be written down for later usage:
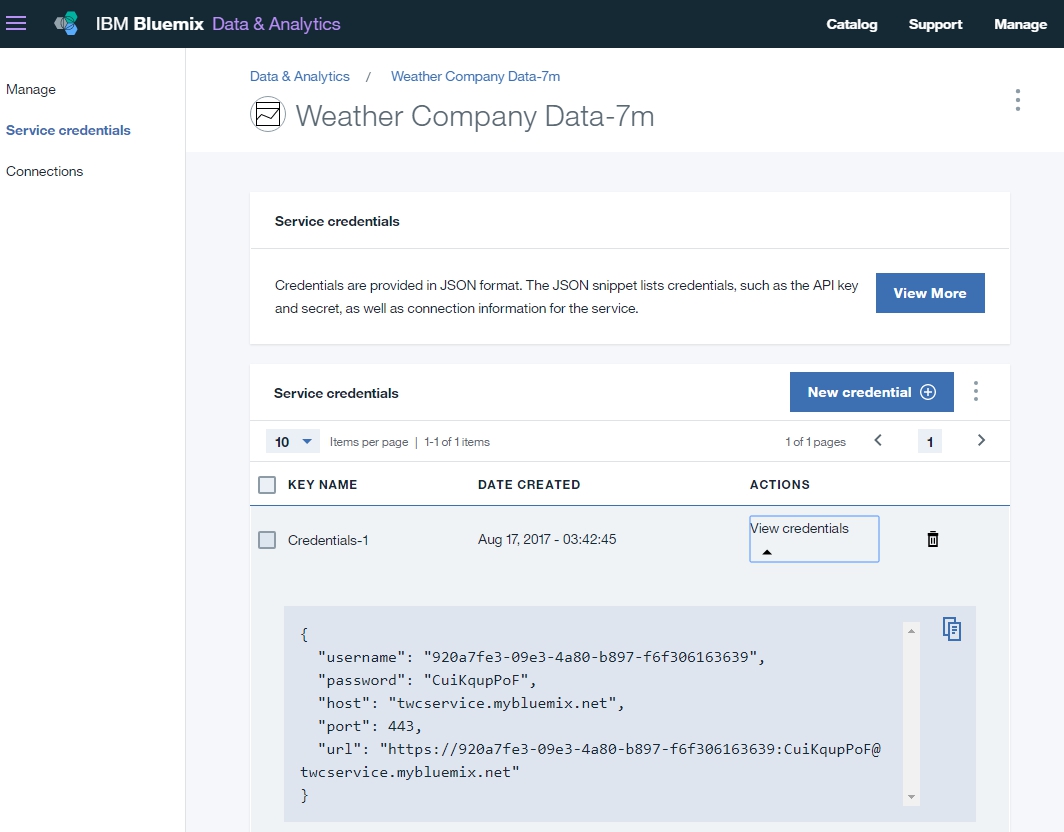


- Copying to the Clipboard the Service Credentials:


2 - Creating a NODE-Red flow

- Installing additional NODE-Red nodes necessary for accessing IBM Weather Company Data for Bluemix:


- Starting NODE-Red:


- Now, a NODE-Red flow must be created composed of 6 nodes:

1) Inject


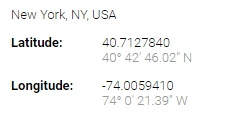
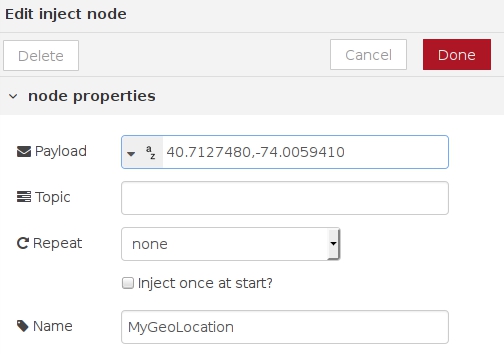
- The payload of the inject node is the geo position (latitude and longitude) of the location of New York City:

http://mygeoposition.com/
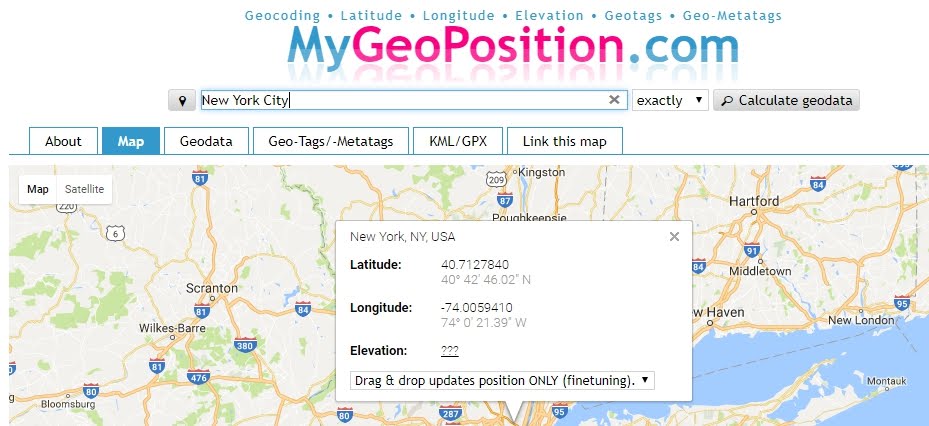


- Entering as payload the Latitude and Longitude of NYC:


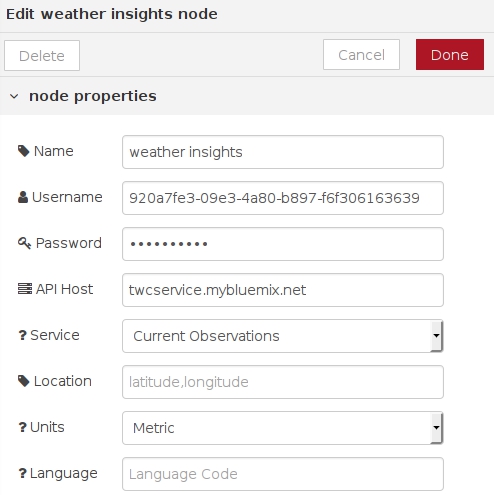
2) Weather Insights


- Entering Username and Password obtained at point 1 (Service credentials) and Current Observations as a Service:


3) Function


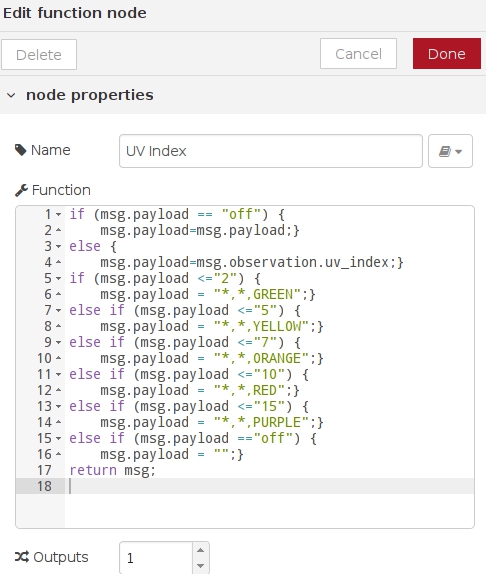
- The function node uses JavaScript code to process the payload coming from the previous node weather insights.

- Editing the node, the conditional statements (if ... else) are based on the Colour Index Scale provided by the United States Environmental Protection Agency.

- Also, when an "off" payload is injected the Sense Hat LED is turned off (we''ll see in next nodes):


https://www.epa.gov/sunsafety/uv-index-scale-1


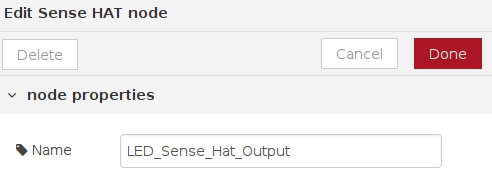
4) Sense Hat


- This node corresponds to the Sense Hat module, and no special configuration is needed aside from giving a name (LED, because its color varies according to the UV Index):


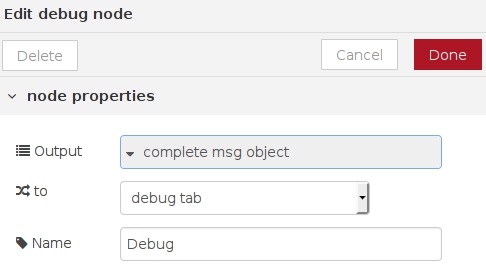
5) Debug

- The Debug module displays the output obtained from the function and the weather insights nodes:



6) Inject

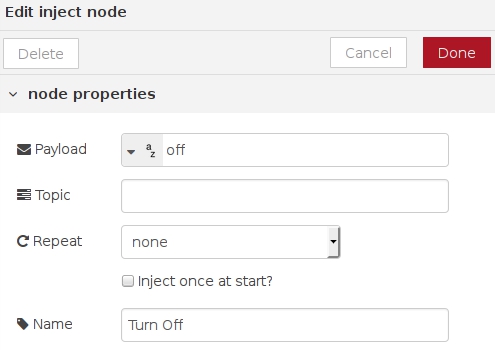
- The last node injects the string "off" to turn off the Sense Hat LED node:


3 - Testing the system

- Deploying the flow:


- Starting the MyGeoLocation node:


- The flow starts working:


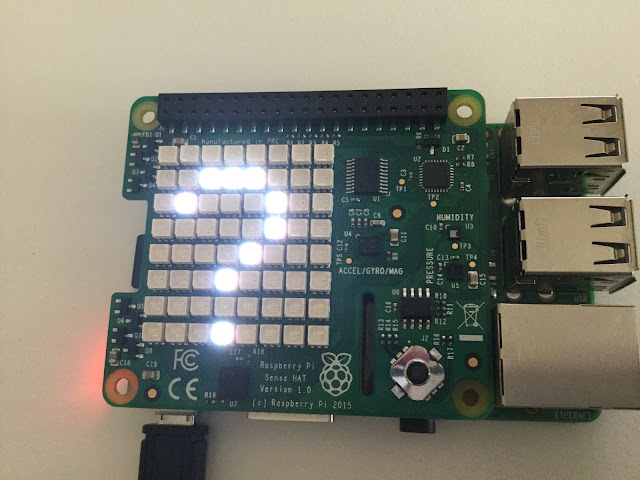
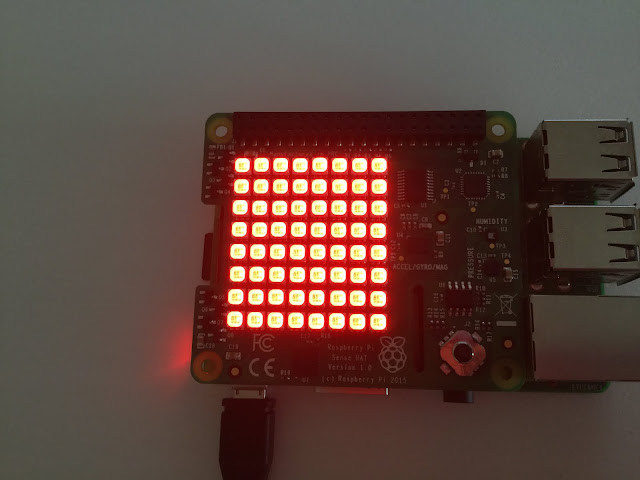
- The LED turns on RED because at the time of the test the UV Index at New York City is closed to 8:


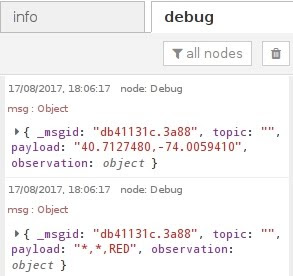
- The Debug tab displays the RED value and the associated New York City's geolocation:


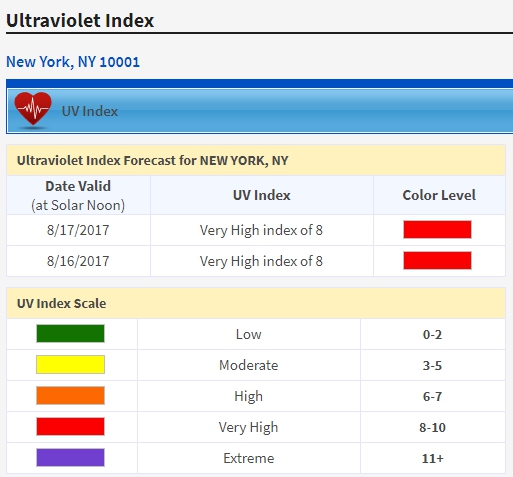
- To check that the test is correct let's consult another UV Index source for New York City:

http://legacy.weather.weatherbug.com


- Finally the node can be turn off:


IBM Watson IoT (3): marble maze game with Raspberry Pi / Sense Hat and Node-RED


IBM WATSON IoT (3): MARBLE MAZE GAME WITH RASPBERRY PI / SENSE HAT AND NODE-RED

- Layout for this exercise


1 - Introduction

- The goal of this exercise is to create a marble maze game using the Motion events properties (accelerometer, gyroscope, magenotmeter compass) and the 8x8 LED matrix provided by the Sense HAT module added on top of a Raspberry Pi device.

- The marble maze game consists of 3 types of colored and lighted dots: green (walls that cannot be traversed), red (one dot, what moves trying to find the 'goal') and blue (one dot, being the 'goal') . 

- The rest of the dots (unlighted) in the matrix are the paths where the red dot moves along.

- The red dot moves trying to reach the position of the dot blue, at which point the goal of the game is achieved.

Once the goal of the game is achieved a new layout and goal position is automatically generated.

The Raspberry Pi device is connected to the Watson IoT platform where it sends events such as the final position (XY coordinates) of the blue dot each time the goal is achieved.

- This video shows how the game works:


2 - Creating a Node-RED flow

- The Node-RED flow consists of 4 nodes.

1) Sense Hat Output


- This node is edited for using Motion events:


2) Sense HAT Input


- No special edition for this node:


3) Function


- The node function generates the layout, the green walls, the red and blue dots, as well as collects the movement of the Raspberry Pi sensors:


- JavaScript code of the function:

// New layout and goal position

function updateGoal() {
 do {
 goalX = Math.floor(Math.random()*7)+1;
 goalY = Math.floor(Math.random()*7)+1;
 } while(checkWall(goalX,goalY));

 flow.set('goalX',goalX);
 flow.set('goalY',goalY); 
}

// Generating walls

function generateWalls() {
 walls = [];
 for (var i=0;i<10;i++) {
 var wx = 0;
 var wy = 0;
 do {
 wx = Math.floor(Math.random()*8);
 wy = Math.floor(Math.random()*8);
 } while(wx === x && wy === y);
 walls.push({x:wx,y:wy});
 }
 flow.set('walls',walls);
}

// Checking collides with the walls

function checkWall(x,y) {
 for (var i=0;i<walls.length;i++) {
 if (walls[i].x === x && walls[i].y === y) {
 return true;
 }
 }
 return false;
}

// Retrieve positions

var x = context.get('x');
var y = context.get('y');

// Retrieve the current goal position from flow context

var goalX = flow.get('goalX');
var goalY = flow.get('goalY');

// Retrieve the current walls from flow context

var walls = flow.get('walls');

// Generate new walls if needed

if (!walls) {
 generateWalls();
}

// Generate a new goal if needed

if (isNaN(goalX) || isNaN(goalY)) {
 updateGoal();
}

var moved = false;
var ox = x;
var oy = y;

// Initializing the player position

if (isNaN(x) || isNaN(y)) {
 ox = 3;
 oy = 3;
 x = 3;
 y = 3;
 moved = true;
} else {

 // Retrieve the current roll and pitch from the message arriving from the SenseHAT

 var roll = msg.payload.orientation.roll;
 var pitch = msg.payload.orientation.pitch;

 // Move the player based on tilt, ensuring it stays within the bounds of the screen

 var sensitivity = 7;
 if (roll > sensitivity && roll < 90) {
 y += 1;
 moved = true;
 if (y > 6) { y = 7; }
 } else if (roll < 360-sensitivity && roll > 270) {
 y -= 1;
 moved = true;
 if (y < 1) { y = 0; }
 }
 if (pitch > sensitivity && pitch < 90) {
 x -= 1;
 moved = true;
 if (x < 1) { x = 0; }
 } else if (pitch < 360-sensitivity && pitch > 270) {
 x += 1;
 moved = true;
 if (x > 6) { x = 7; }
 }

 // If the resultant position hits a wall, go back to where it started

 if (checkWall(x,y)) {
 x = ox;
 y = oy;
 }
}

// Store the new player position

context.set('x',x);
context.set('y',y);

if (moved) {
 var eventMsg = null;

 // If the player is on the goal, generate a new set of walls and goal position

 if (x === goalX && y === goalY) {
 generateWalls();
 updateGoal();
 // Blank the display
 msg.payload = "*,*,off,";
 eventMsg = {
 payload: {
 x: goalX,
 y: goalY
 }
 };
 } else {

 // Blank the old position of the player

 msg.payload = ox+","+oy+",off,";
 }

 // Draw each of the walls

 for (var i =0;i<walls.length;i++) {
 msg.payload += walls[i].x+","+walls[i].y+",green,";
 }

// Draw the goal and player position

 msg.payload += goalX+","+goalY+",blue,"+x+","+y+",red";

 // Pass  the message to the Sense HAT Out node

 return [msg,eventMsg];
}

// Nothing has moved so no need to update screen - return nothing

return null;


4) Watson IoT


- The Watson IoT node is connected as a Device with the Quickstart service, what it is enough for the purpose of this exercise:


- Deploying the flow:


- Clicking the Quickstart icon:


- The Quickstart service offers information about the XY coordinates of the blue dot, located at the 8x8 LED matrix of the Sense HAT module, every time the goal is achieved: